
Your first Deepwick backtest: from chart to trades
Open the no-signup demo, run Donchian and inspect individual trades. Learn how market data and synthetic examples differ.
Try this example →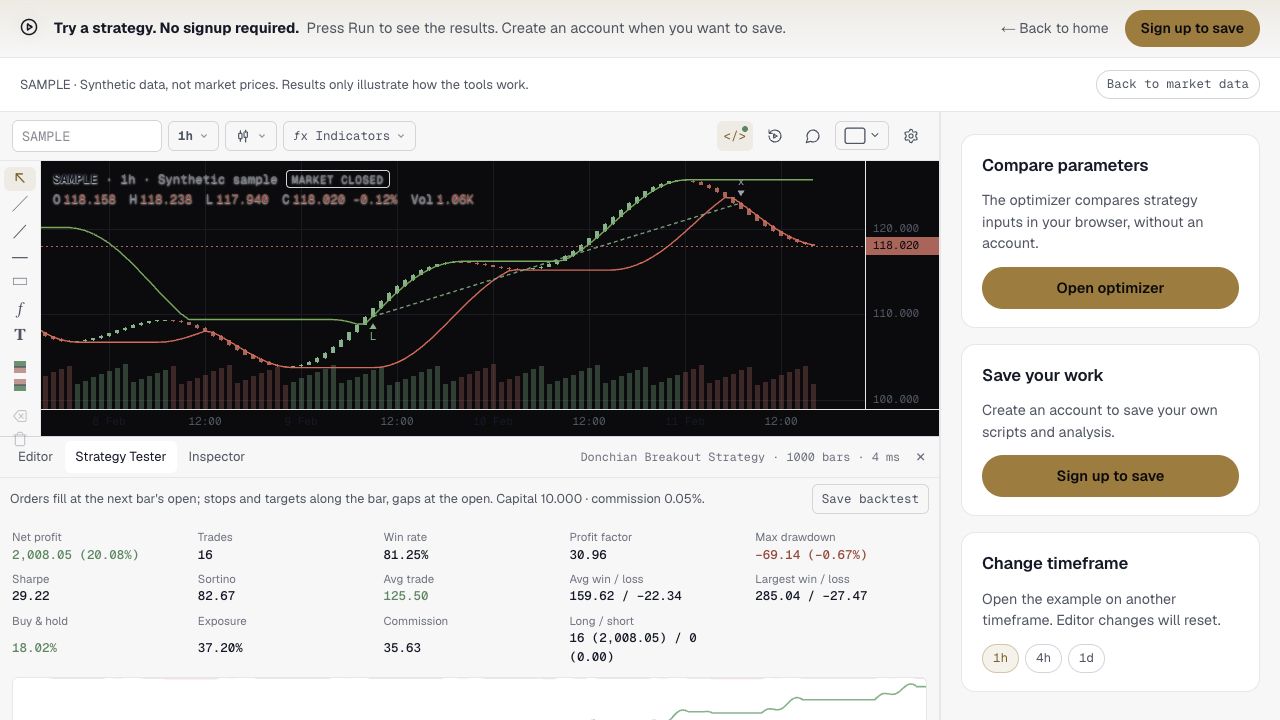
Your first backtest should help you understand what a strategy does. This guide opens a Donchian example, locates its trades and checks what changes on another timeframe. You do not need an account to follow along.
1. Open the example and check its context
Open the Donchian demo on BTCUSDT, one hour. The link loads a strategy and requests up to 1,000 candles. Check the symbol and timeframe in the chart toolbar before reading the report.
The live-data window moves with the market. Runs on different days can produce different results without a code change. Record the date, market, timeframe and report period when comparing experiments.
If data fails to load, choose Retry. You can also choose Use sample data. These synthetic candles let you learn the interface; the «SAMPLE» notice identifies that mode. Its results neither describe BTC nor establish that the strategy works in a market.
2. Read the rule before running it
The Editor tab contains the loaded code. The example looks for a breakout above a Donchian channel and uses exit rules plus an ATR-based stop. Inputs control channel lengths and the stop multiplier. Read the actual conditions in the script: those govern this run.
The strategy() declaration also shows starting capital, position sizing and commission. An example commission does not replace your broker's conditions. Do not assume a demo report includes every cost of a real transaction.
Press Run if results have not appeared, or after editing the code. Resolve compilation errors before continuing: a visible chart does not mean the strategy has executed successfully.
3. Inspect one complete trade
Open Strategy Tester and check that it reports trades. Read net profit and drawdown, then inspect the trade table. Each row records an entry and an exit.
Click a trade to locate it on the chart. Compare the entry with the strategy signal. In Deepwick's engine, a market order generated at a candle's close normally fills at the next candle's open. A signal and its fill need not have the same price.
Then inspect the exit. A channel condition and a stop are different triggers. If a trade differs from your expectation, return to the code before changing inputs to improve the reported performance.
4. Change one thing
Choose 4h under «Change timeframe». Opening another interval resets editor changes in the demo, so copy any edits first. Keep the same data mode when comparing.
One thousand hourly candles and one thousand four-hour candles span different lengths of history. This comparison therefore changes both the timeframe and the observed period. Record that limitation beside the result.
5. Continue with a specific question
Open optimizer compares input ranges for the seeded example. It works with that example strategy, not an automatically synchronized copy of your chart-editor changes. To investigate your own script, save it to your account and use the dashboard workflow.
The anonymous session is for exploration. Create an account when you want to save work, and copy your edits before leaving. Next, read how to interpret a backtest. It helps you ask a more useful question than «how much did it make?».